Why Points of No Return Matter
A lake can absorb pollution for years and still look healthy—until algae spread rapidly and oxygen levels collapse. A power grid can handle small disruptions—until one failure triggers others and causes a widespread outage. These are points of no return: moments when gradual pressure produces a sudden shift, and restoring the old condition becomes difficult, costly, or impossible.
They matter because ordinary observation often catches the problem too late. Researchers therefore look for changes that appear before the breakdown, such as slower recovery after disturbances, growing fluctuations, or stronger links between parts of the system. These signals cannot reveal the exact moment of collapse with certainty. They can, however, show that a system is losing resilience, giving people a chance to reduce pressure, prepare alternatives, or decide when delay has become too risky.
What Makes a Chaotic System Unpredictable
The difficulty begins with sensitivity to starting conditions. In a chaotic system, a tiny difference in temperature, timing, population size, or network load can grow until two nearly identical situations produce very different outcomes. The rules may be fixed, but small measurements are never perfectly exact. A forecast can therefore lose accuracy as it looks farther ahead, much as a weather prediction becomes less reliable several days into the future.
Nonlinear feedback makes the problem harder. A small change may have little effect at first, then pass a threshold that activates reinforcing processes: melting ice exposes darker water that absorbs more heat, or one overloaded power line pushes more electricity onto others. These feedbacks can amplify disturbances instead of smoothing them out. Near a tipping point, recovery may also slow, so the system becomes more vulnerable to ordinary shocks.
This does not make prediction useless. Researchers can often estimate rising risk from patterns across many observations, but they usually cannot identify the exact time, size, or path of the transition. The result is better understood as a warning about shrinking resilience than as a guaranteed timetable.
The Warning Signs Hidden Before Collapse

One warning sign is that the system takes longer to return to its usual state after a disturbance. A lake may clear more slowly after a storm, or a financial network may need more time to absorb a failed institution. This “critical slowing down” suggests that stabilizing forces are weakening. Researchers also watch for larger swings, because a system with less resilience may overshoot in both directions rather than settling quickly.
Other clues appear in the relationships among measurements. Temperature, water quality, species numbers, or network loads may begin moving together more closely, indicating that separate parts are becoming linked by a common pressure. Statistical patterns such as rising variance and stronger autocorrelation can support that interpretation. None of these signals proves that collapse is imminent. Weather, measurement errors, seasonal cycles, or a temporary shock can create similar patterns, and some systems show no clear warning at all. Researchers therefore compare several indicators across time and test whether the changes persist, treating them as evidence of increasing risk rather than a countdown to a known date.
How Researchers Test the Prediction
To test whether these signals really precede a tipping point, researchers begin with systems whose rules or histories can be examined closely. They may run computer models, recreate transitions in laboratory ecosystems, or analyze long records from lakes, forests, climate patterns, and infrastructure networks. The aim is not simply to find a pattern after collapse, but to test whether the same indicators appear before many different transitions.
Researchers then divide the evidence into an earlier period used to identify warning signals and a later period used to test them. They compare systems approaching a known transition with stable systems exposed to similar disturbances. Statistical methods can measure whether recovery is slowing, fluctuations are increasing, or connections among variables are strengthening beyond what random variation would explain. Models may also be deliberately stressed to see whether they forecast higher risk before failure occurs. This process is difficult because data are often short, noisy, or unevenly collected, while real systems may change for several reasons at once. A useful test therefore asks how often the warning appears before collapse, how often it gives a false alarm, and how much time it provides.
From Equations to Real-World Decisions
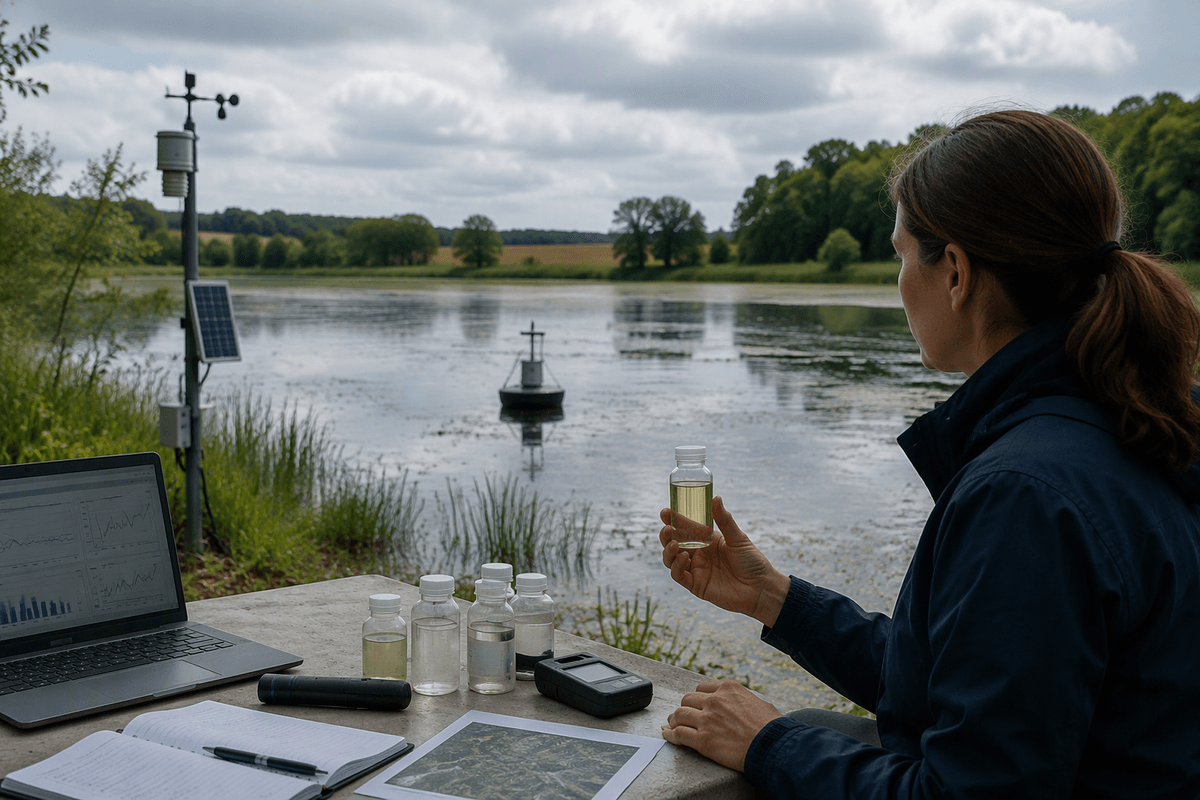
A warning signal becomes useful only when it changes a decision. A water manager might respond to slower lake recovery by reducing nutrient runoff, while a grid operator could keep extra generating capacity available when fluctuations and connections among failures increase. In both cases, the research does not provide a precise appointment with disaster. It helps decision-makers judge whether the cost of precaution is lower than the likely cost of waiting.
That judgment depends on the system and the consequences of being wrong. If an intervention is cheap and reversible, a modest increase in estimated risk may justify acting early. If shutting down a facility would disrupt essential services or impose major economic costs, officials may require several independent indicators before taking action. Forecasts can also guide monitoring: researchers may collect data more frequently, test alternative models, or focus resources on the parts of a system showing the greatest loss of resilience.
The practical value, then, lies in narrowing the choices rather than eliminating uncertainty. Equations can reveal that a system is entering a more dangerous state, but people still must decide how much risk to accept, who bears the cost of preparation, and when precaution should begin.
Why Prediction Does Not Mean Certainty
A forecast that says a system is becoming less stable is not the same as a forecast that says collapse will occur on a particular day. Warning indicators usually change the odds, not the outcome. A lake showing slower recovery may still avoid a major shift if pollution is reduced, while an apparently stable lake may cross a threshold after an unexpected heat wave. The same signal can therefore support different outcomes under different conditions.
Uncertainty comes from several sources. Measurements may be too sparse to capture rapid changes, models may leave out an important feedback, and outside forces can alter the system before the predicted transition occurs. Researchers also face a difficult balance between false alarms and missed warnings. Acting on every sign of rising risk would waste resources and disrupt useful activities; waiting for conclusive proof may leave too little time to respond. Probabilistic forecasts are valuable because they make those trade-offs visible. They do not remove judgment, but they can show when confidence in continued stability is no longer justified, especially when several independent indicators point in the same direction.
Using Warnings Before the Window Closes
The most useful response to an early warning is rarely a single dramatic intervention. It is a set of steps taken while choices remain available: reduce the pressure driving the system, protect vulnerable components, prepare backup capacity, and decide in advance what evidence will trigger stronger action. A coastal community might restore wetlands and improve evacuation plans; a technology operator might lower network loads and test a backup system before failures spread.
Acting too early can waste money or impose unnecessary restrictions, but waiting for certainty may close the window for affordable change. Warning signals are therefore best treated as prompts for staged decisions, with regular reassessment as new data arrive. They do not predict the future perfectly. They help reveal when preserving the current path is becoming riskier than changing it.